Architecture
Table of Contents
Overview
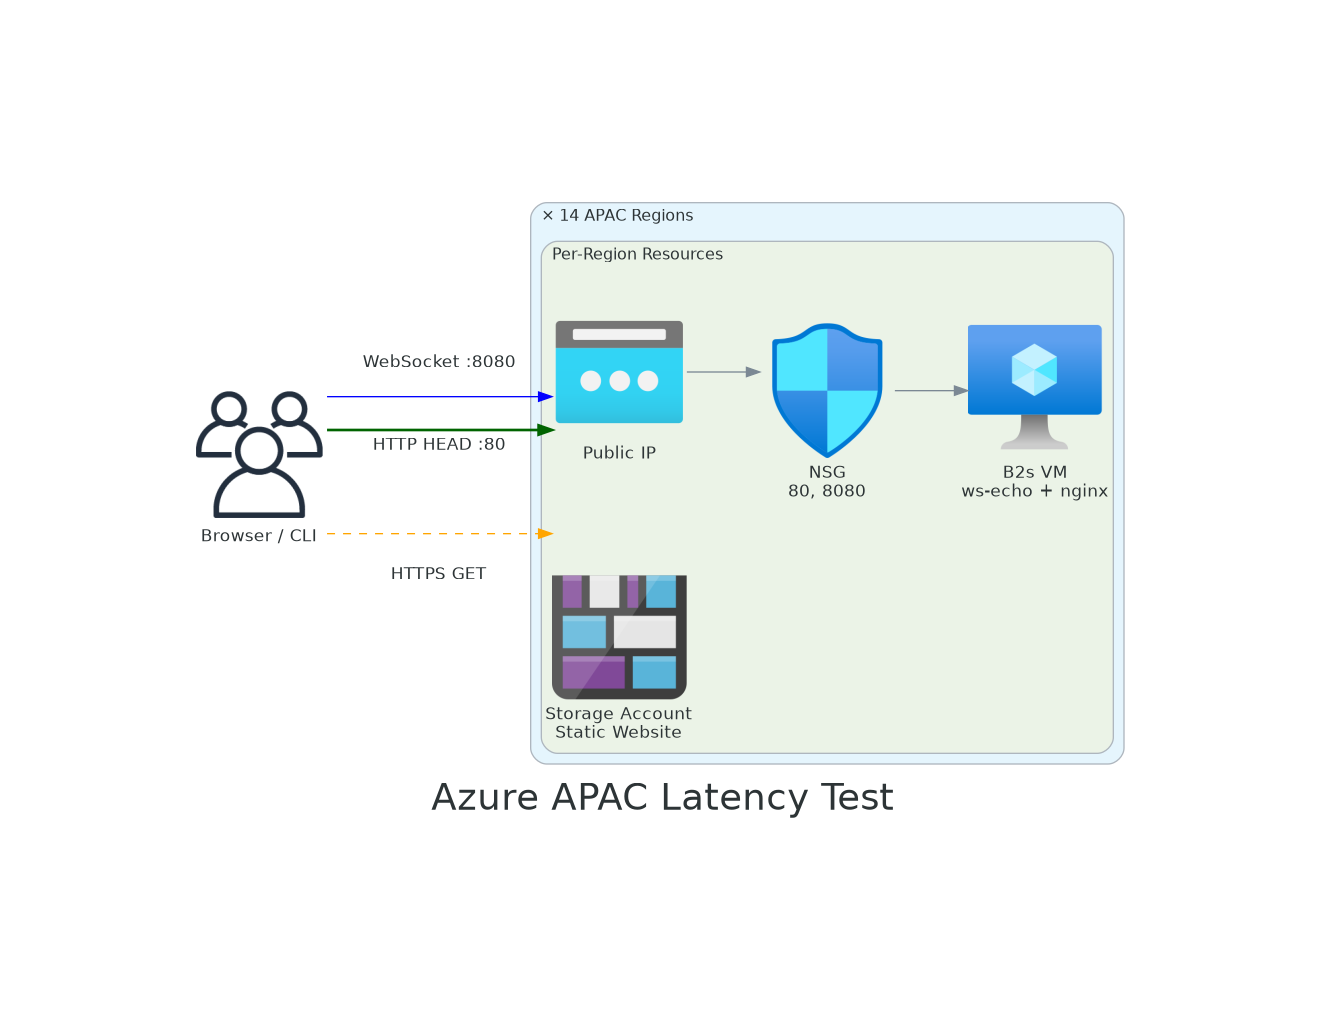
The Azure APAC Latency Test is a distributed measurement platform that deploys lightweight infrastructure across 14 Azure regions in Asia-Pacific. It enables real-time latency measurement from any client browser using three complementary protocols — WebSocket, HTTP, and Blob Storage — to provide a complete picture of network performance across the region.
Design Goals
| Goal | Approach |
|---|---|
| Low cost | Standard_B2s VMs (~$30/mo each), no premium SKUs |
| Idempotent deployment | Scripts can be re-run safely; create-or-skip logic |
| Client-side measurement | All latency measured from the browser — no server-to-server |
| Multi-protocol | WebSocket (persistent), HTTP (request/response), Blob (storage layer) |
| Minimal dependencies | Azure CLI only, no Terraform/Bicep required |
| Comprehensive APAC coverage | 14 regions including new markets (Indonesia, Malaysia, New Zealand) |
Technology Stack
| Layer | Technology | Details |
|---|---|---|
| Frontend | Angular 17 | Real-time dashboard with Chart.js visualizations |
| WebSocket Server | Node.js + ws | Echo server on port 8080, measures true RTT |
| HTTP Server | nginx | Lightweight reverse proxy, HEAD request on port 80 |
| Storage | Azure Blob (Static Website) | 1KB test payload, measures storage layer latency |
| Compute | Ubuntu 24.04 LTS on B2s | cloud-init provisioned, systemd-managed services |
| Networking | NSG + Public IP (Static) | Inbound 80/8080 only, no outbound restrictions |
| Deployment | Bash + Azure CLI | Idempotent scripts in deploy/ directory |
How It Works
- Deploy — Azure CLI scripts provision 14 VMs + 14 Storage Accounts across APAC
- Measure — Angular app opens connections from the user’s browser to each region
- Compare — Dashboard shows latency differences by protocol and region in real-time
- Analyze — Results reveal physical distance impact, protocol overhead, and regional maturity
Per-Region Resources
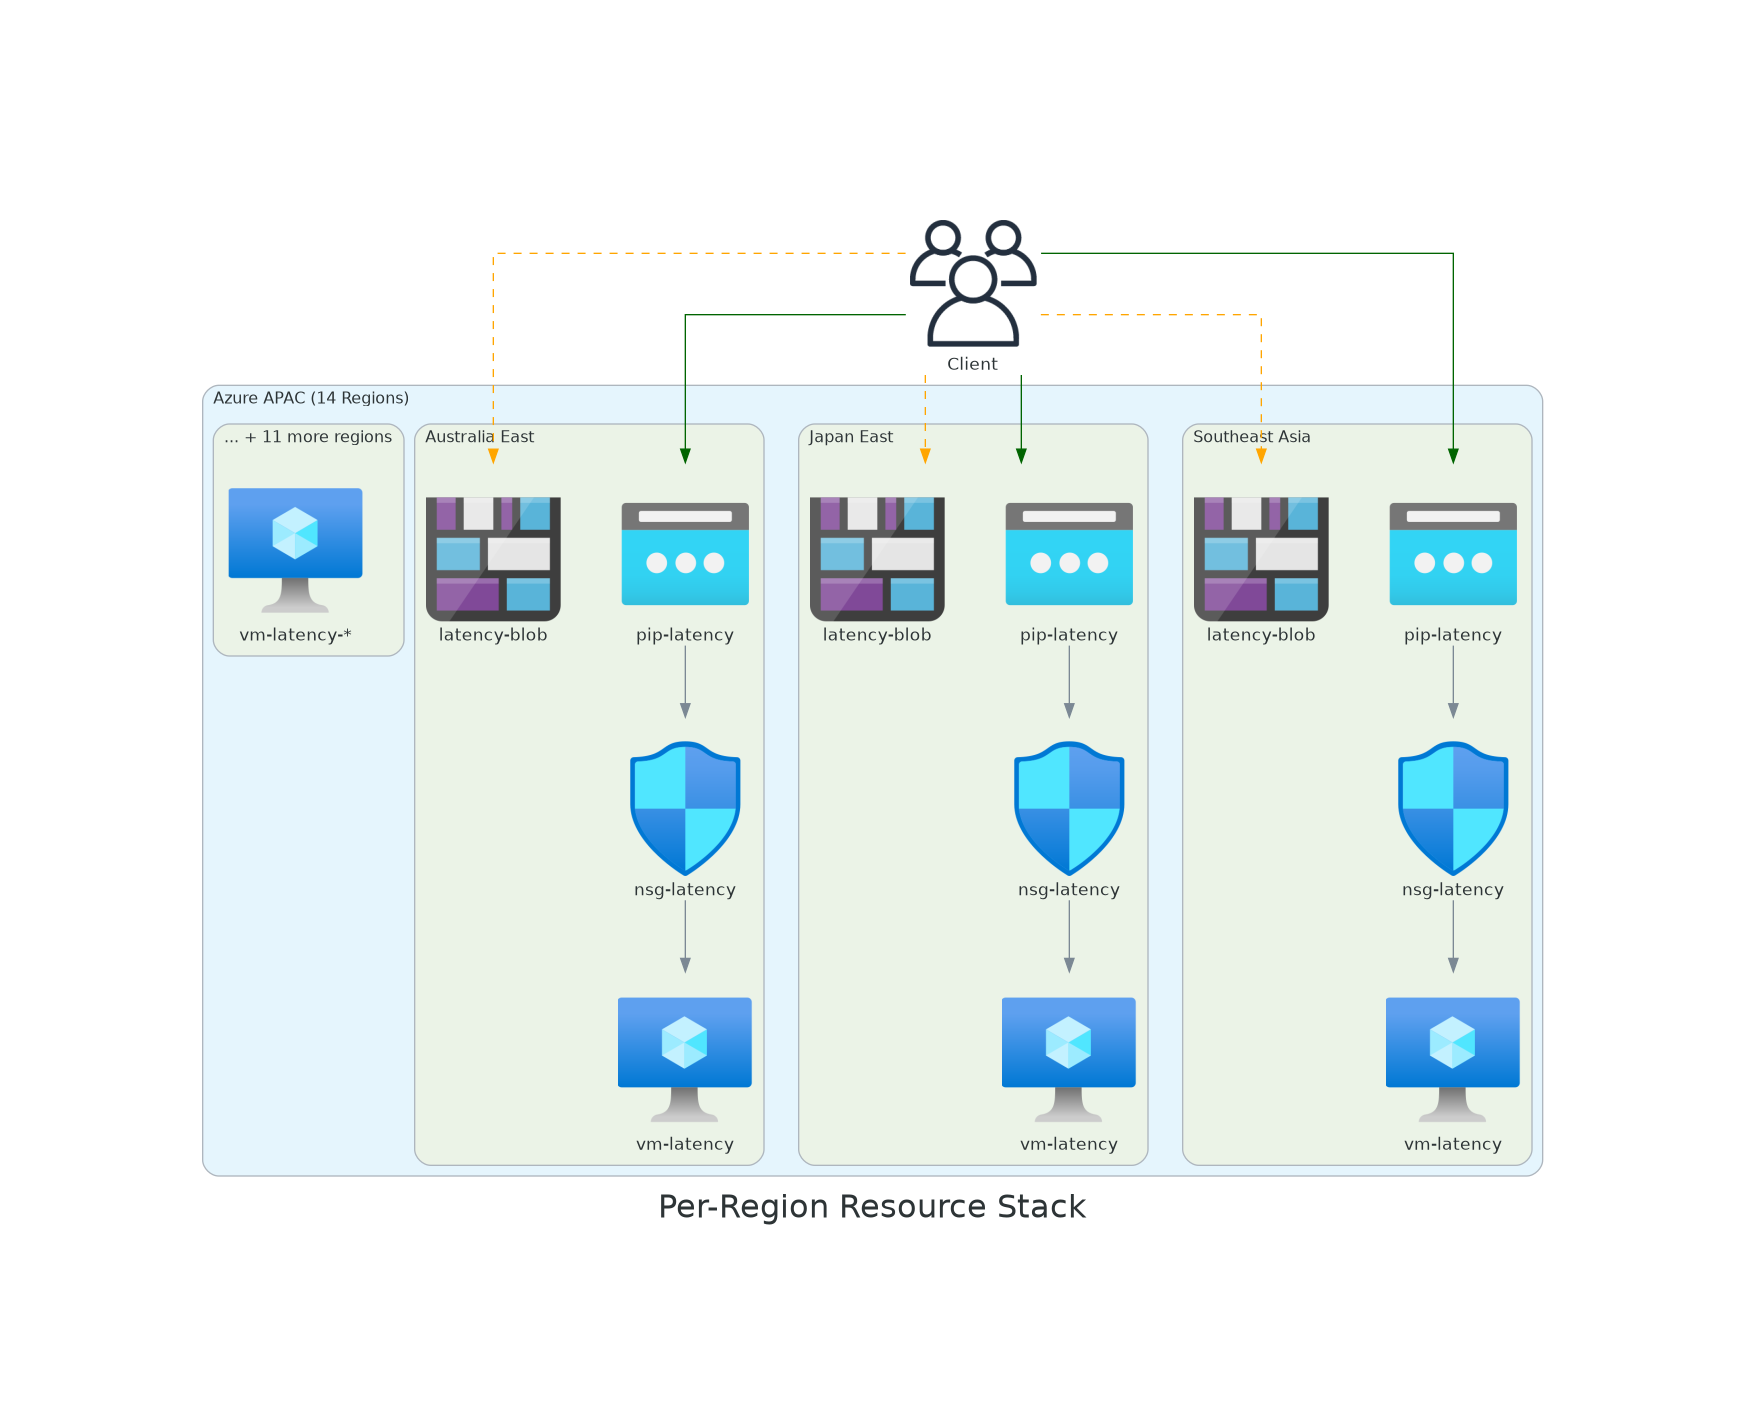
Each of the 14 regions contains:
| Resource | Name Pattern | Purpose |
|---|---|---|
| Resource Group | rg-latency-{region} | Logical container |
| VM | vm-latency-{region} | WebSocket + HTTP endpoint |
| NSG | nsg-latency-{region} | Firewall rules (80, 8080) |
| Public IP | pip-latency-{region} | Static IP for testing |
| Storage Account | latency{region} | Blob latency endpoint |
Latency Measurement Types
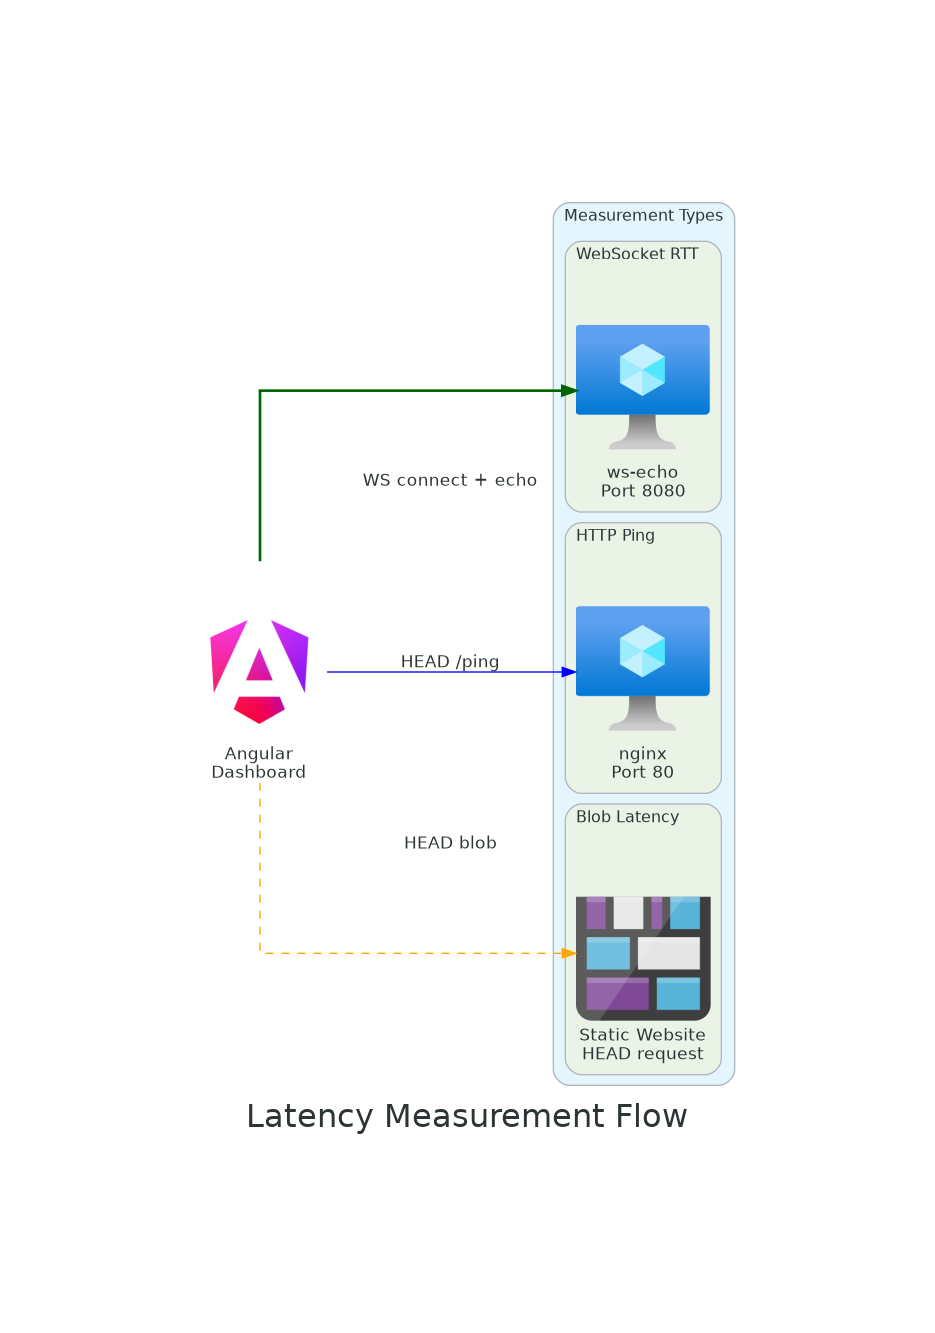
WebSocket (Primary)
- Persistent TCP connection on port 8080
- Measures true round-trip time for data echoing
- Most accurate for real-time application latency
HTTP Ping
- HEAD request to nginx on port 80
- Measures HTTP request/response overhead
- Includes TCP + TLS setup on each request
Blob Storage
- HEAD request to Azure Storage static website
- Measures storage infrastructure latency
- Includes DNS + TLS + storage front-end processing
Network Path
Client → ISP → Azure backbone → Region POP → VM NIC → Application
Latency is dominated by:
- Physical distance (speed of light in fiber)
- Network hops (routing efficiency)
- TLS overhead (for HTTPS/WSS)
- Application processing (negligible for echo)
Regenerating Diagrams
The architecture diagrams are generated using mingrammer/diagrams. To regenerate:
pip install diagrams
cd docs/diagrams
python3 architecture.py